Observatory 2023 of UAP reports in French-speaking Belgium

Compilation and analysis for on behalf of COBEPS by Jean-Marc Wattecamps, head of the investigator network. This compilation was produced on February 7, 2024
-
to come up with a regular and cumulative inventory of reports of aerospace phenomena which are unidentified (UAP) by witnesses at the time of their observation, in French-speaking Belgium, all organizations taken altogether;
-
to highlight the main time-space characteristics of the reports as well as some other descriptive statistics.
Introduction
The objectives of this observatory are:
This work is carried out by COBEPS and features data collected and shared by other organizations and in particular Belgisch UFO-meldpunt and SOS-OVNI Belgique. The “Origine” group and MUFON France-Belgium also passed on their observations.
The aim is to provide an as exhaustive as possible overview of Belgian UFO activity (in Wallonia and Brussels). All your data is welcome, it will be disseminated via the data dashboard on the COBEPS homepage. This dashboard can be used on your site, should you want to, under the Creative Common version 4.0.This means that it can be taken over, copied, modified as long as the resulting work is distributed under the same conditions and for non-profit purposes. The source must also be mentioned in its entirety: in this case JMWS2020.
This report, as well as its data, are available under the same conditions. The source in this case is www.cobeps.org, or if you take the cases of our partners, included in the database: their respective references.
By “report” we mean: the statements of one or more witnesses of an observation of a UAP which remains unidentified for them. An often used synonym is “notification”. We stop counting reports on December 31 at midnight local time of the year 2023 (reports transmitted/known no later than February 7, 2024).
- imprecision in dating the event;
- altered quality of witnesses’ memories;
- difficulty of being able to reconstruct facts, due to access or modification of places of observation;
- impossibility of having radar and weather data to compare the testimony with possible elements of explanation.
1. Presentation of reports as of December 31, 2023
The data has been centralized in a database maintained by COBEPS since 2010 (year the survey began). The observatory has been studying the data compiled and incremented since then. The total number of reports of sightings that occurred on or before 12/31/2023 at 11:59 p.m. is 1308. As of 02/07/2024 we have recorded 73 reports, compared to the last annual report although 22 of them concerned sightings before this year. Three reports regarding the year 2023 reached us in 2024. There are therefore 51 reports encoded during the period with regards to observations carried out in 2023.
As for observations in Flanders, we invite you to consult the Belgisch UFO-meldpunt. An agreement to exchange reports exists between both organizations. Exchanges with SOS-OVNI or ORIGINE or MUFON were also frequent but not formalized. COBEPS also receives one or two quarterly reports for observations made by witnesses located outside Belgian territory. They are not included in this database. These reports are most often transmitted to organizations in the corresponding countries.
Collection of reports
This file is intended to be exhaustive. However, we do not have all the sources and it is likely that we are still missing some reports. We compile everything we find on the Internet thanks, among other things, to “Google Alerts” with the following keywords: “unidentified aerial phenomenon Belgium, UFO Belgium, UFO Brabant, UFO Brussels, UFO Charleroi, UFO Hainaut, UFO Liège , UFO Luxembourg, UFO Mons, UFO Namur, UFO Nivelles, UFO Tournai, UAP Belgium, flying saucer Belgium, Belgian triangle, UFO Belgium, Belgian wave.” We exclude from this research YouTube, Dailymotion, etc. videos which do not present enough information to identify with certainty the authors, locations, dates, times. We do not compile non-French speaking sites at this time. On the other hand we regularly receive reports through partner organizations and exceptionally from the authorities (see the origin of the information Table 1).
Table 1: recipients of the 1308 reports
| Origin of information | Number | Percentage |
|---|---|---|
| COBEPS | 927 |
70,87 % |
| Foreign internet forum/blog | 58 |
4,43 % |
| MUFON | 50 |
3,82 % |
| REUB | 50 |
3,82 % |
| Press/TV/radio | 42 |
3,21% |
| ovni-ufologie.com | 38 |
2,91 % |
| UFOs UFO Forum | 38 |
2,91 % |
| Belgisch UFO-meldpunt | 28 |
2,14 % |
| SOS-OVNI | 27 |
2,06 % |
| AREPS | 21 |
1,61 % |
| Others | 27 |
2,06 % |
| Grand Total | 1308 |
100 % |
Speed of reporting
We reviewed the available data on the gap, in number pf days, between reporting and observation. Old cases reported do not always contain a precise date of observation.
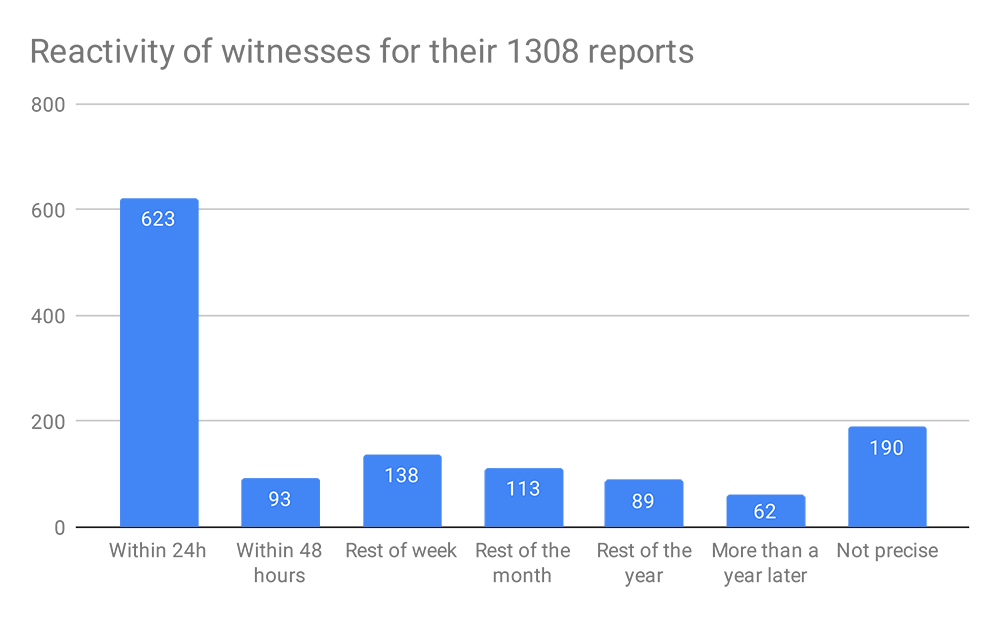
Figure 1: recipients of the 1308 reports
The majority of reports are made in the very first days after the sighting (Figure 1). The Internet facilitates witnesses responsiveness: 47.63 % of reports arrive within 24 hours and 54.74 % within 48 hours. This allows for investigators to quickly contact witnesses, which is undeniably beneficial for the quality of the memory of reported events.
Recent reports concerning old observations (often several years old: Figure 1, last two columns) relate to generally more complex and interesting phenomena, but they are also more difficult to investigate. The difficulties mainly lie in:
- A: those that are perfectly identified;
- B: those that are probably identified;
- C: those that are well investigated and remain quite strange following the collection of testimonies but where the available information does not allow us to comment with certainty on the unidentified nature of the case;
- D: those that remain unidentified by competent people who have enough information to make a decision, following a thorough investigation..
2. Time-space characteristics of observations
2.1. Witnesses geographic distribution
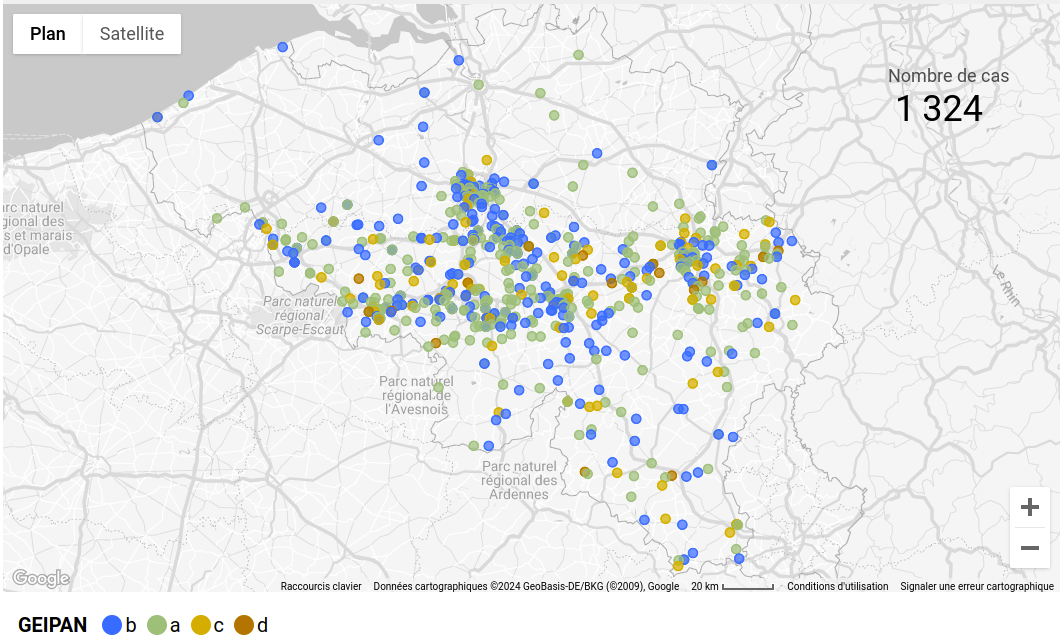
Figure 2: map of witnesses positions
Most observations were made by witnesses located in high-density population areas: Brussels, the Sambre and Meuse line and the axes which connect Brussels and the large Walloon cities (Figure 2). There are only 22 UAP’s D in the entire database (with reports prior to 2010). This is little and statistically too low to draw definitive conclusions, but the distribution of these UAP’s D (not identified as “solid”) does not seem differ from that of the other GEIPAN classes (see Figure 8).
2.2. Time distribution of observations
2.2.1. Annually
2010 is not significant and was not included in the annual statistics. The collection had as a matter of fact not yet been systematized; since then, the collection method remained unchanged.
The yearly average rate stands at 90.67 notifications between 2011 and 2023 (1152 cases, the year of which is precisely known). The interquartile space is located between 78 and 103. 2012 had the greatest number of observations with 126 cases. 2017 was the poorest with 50 cases. There were 51 observations in 2023, which makes it, in number, the second lowest year (Figure 3). These figures are likely to change slightly in future reports, since we regularly receive reports concerning observations from previous years.
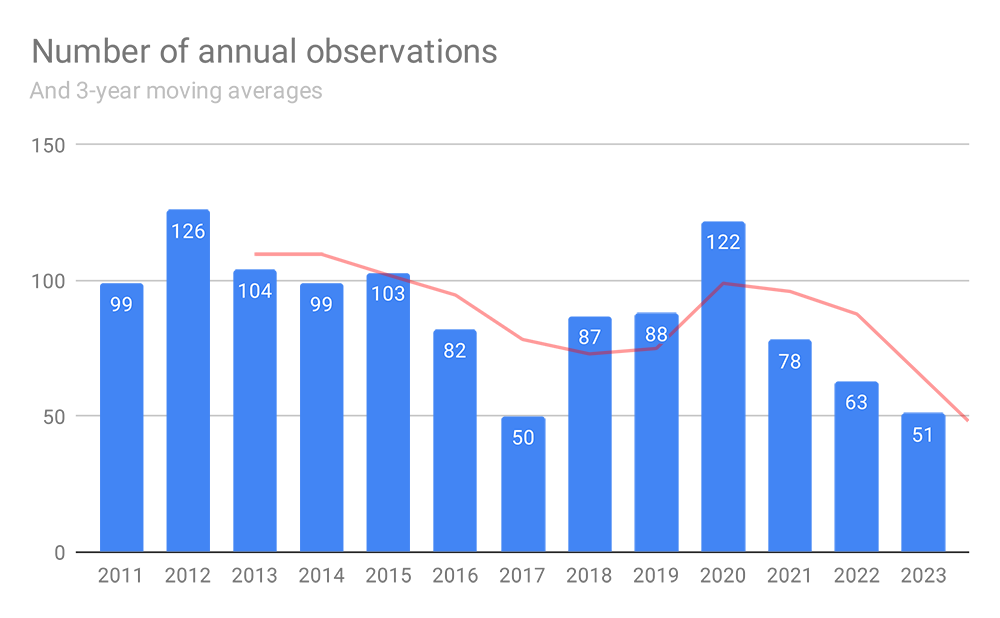
Figure 3: annual changes and trends
If one further analyses the data collection in the same way, one can spot the general trend. It is the gradual reduction in the number of observations. The year 2020 is an exception. The number of reports increased that year, due to the increase in flights of Space X's Falcon rocket, to put Starlink satellites into orbit. The forecast based on these moving averages indicates for 2024 that the number of observations would amount to 64.
Reports classification
At the end of a more or less in-depth investigation, depending on the case 1, the UAPs are classified into:
COBEPS added the code “X” to its database, in the column dedicated to the classification of UAPs. This code was applied to the data of the entire database in February 2016, then used routinely. “X” generally means “not investigated”; there was no real research for various reasons (not very strange case: very distant night light, very incomplete form, absence of witness contact details, witness not wishing to answer additional questions or participate in investigations, etc.) and therefore the information is very insufficient for an effective classification. In addition, one can also come across “EC” as a code, which stands for: code “EC”: evaluation or investigation in progress.
This classification is inspired by that of GEIPAN.
In order to get a match between both classifications, it is necessary to consider the UAP X of COBEPS as UAP C.
GEIPAN classification by year (1152 cases)
| Year | A |
B |
C |
D |
EC |
X |
Total |
|---|---|---|---|---|---|---|---|
| 2011 | 38 |
17 |
20 |
4 |
0 |
20 |
99 |
| 2012 | 36 |
36 |
8 |
4 |
0 |
42 |
126 |
| 2013 | 41 |
21 |
8 |
3 |
0 |
31 |
104 |
| 2014 | 38 |
21 |
7 |
2 |
0 |
31 |
99 |
| 2015 | 26 |
25 |
5 |
1 |
0 |
46 |
103 |
| 2016 | 23 |
12 |
2 |
0 |
0 |
45 |
82 |
| 2017 | 10 |
14 |
1 |
0 |
0 |
25 |
50 |
| 2018 | 15 |
18 |
10 |
0 |
0 |
44 |
87 |
| 2019 | 34 |
18 |
4 |
1 |
1 |
30 |
88 |
| 2020 | 52 |
30 |
3 |
0 |
6 |
31 |
122 |
| 2021 | 34 |
19 |
3 |
0 |
0 |
22 |
78 |
| 2022 | 19 |
12 |
1 |
0 |
5 |
26 |
63 |
| 2023 | 15 |
18 |
3 |
0 |
4 |
11 |
51 |
| Total | 381 |
261 |
75 |
15 |
16 |
401 |
1152 |
The number of UAP’s D has been decreasing in recent years. The proportion goes went from 7.69 % in 2010 to 0 % from 2016; with the exception of 2019, where a UAP was classified D by the ORIGINE group, regarding an observation made in Belœil. Note that at the end of the survey there will certainly be a UAP’s D in 2023 (LN).
The proportion of UAP’s C is also constantly decreasing, which reflects the fact that the information collected is increasingly complete, of high quality and allows for more secure classification. The percentage of UAP’s B fluctuates between 15 and 35 %, that of UAP’s A varies between 17 and 44 %. The proportion of UAP’s A will continue to increase in the years to come, given the growing experience of our investigators and the means of identification which are increasingly efficient.
2.2.2. Monthly
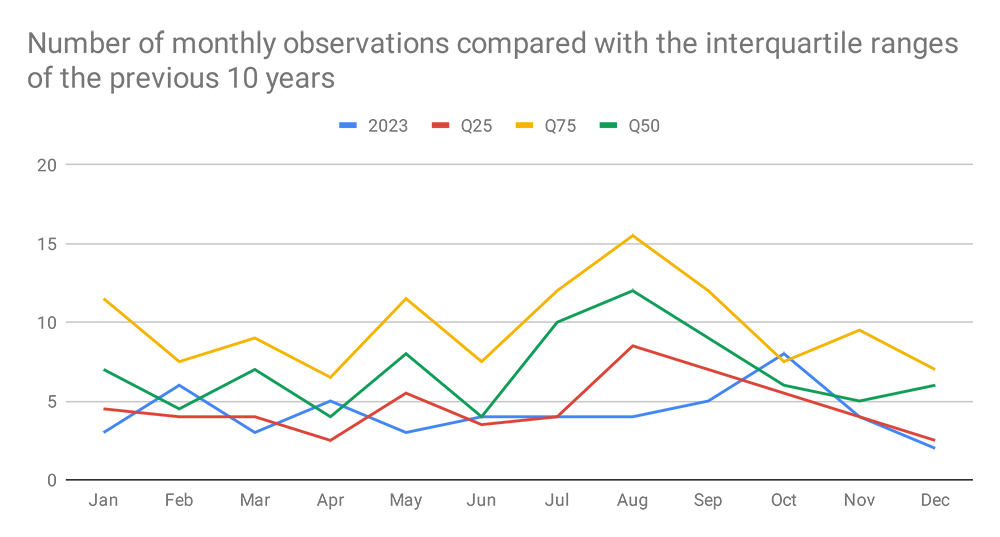
Figure 4: monthly trends compared with interquartile range
The monthly distribution of observations for the year 2023 is inevitably related to the significant decrease in the number of reports, for the most part, below the monthly thresholds, marked here by the interquartile space of the previous 10 years. Only the months of February, April and especially October (very slightly above the Q75) are within the “norms”. The month of August is particularly poor in reports while it is usually a month rich in sightings. These differences are significant compared to the median (Q50) of the previous ten months. The Chi2 test indicates that the null hypothesis of equivalence between Q50 and 2023 can be rejected at the 5 % threshold (Pobs = 0.0195 – 1.95 %).
The meteorological parameters of hours of sunshine and number of days of precipitation provide indications of the intensity of cloud cover. The data collected at the IRM – at the Uccle reference station – are compared to the number of reports from 2023 in Figure 5. There is no apparent relationship. The brighter and less rainy periods do not present significant observation peaks. But Uccle is not always representative of the state of the sky. It would be necessary to establish a strategy for comparing visibility due to meteorological parameters and the number of reports. To this end, the database has a field dedicated to these which uses synoptic data from the airport closest to the location of each observation. We record visibility in kilometers and sky coverage.
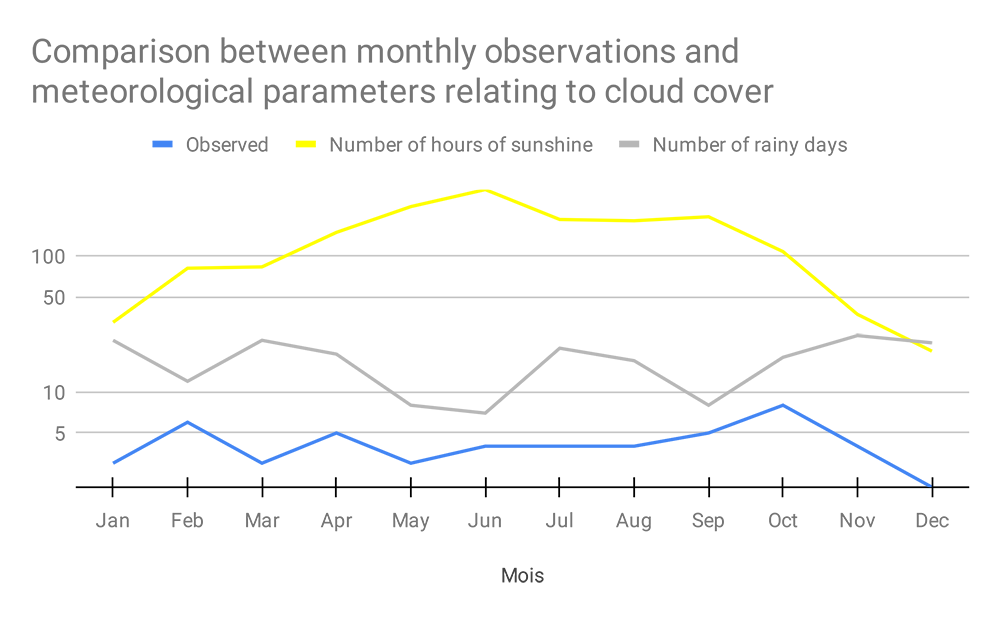
Figure 5: comparison with sunshine hours and rain day
- at least two direct witnesses (optional);
- apparent size at least equal to the full Moon (required);
- observation of at least 20 seconds and at most 30 minutes (mandatory);
- clear discernible shape: the main witness can draw an outline or shape (obligatory);
- movement of the phenomenon in a sector other than the opposite of the direction the wind is coming from (± 45°) (mandatory);
- presence of a trace: material element on the ground, photo, etc. (optional).
- 732 cases were classified A/B/C or D according to the GEIPAN nomenclature;
- 75 resulted in the production of an short investigation report (CRE) or a detailed report (RDE) by COBEPS, which implies an in-depth investigation;
- 61 resulted in a simple identification sheet;
- 43 investigation files are published on the COBEPS website;
- 16 investigations are under evaluation or in progress.
3. Signal/noise analysis
COBEPS analyzes his own reports and classifies the observations according to the GEIPAN classification standards, as explained above (see 2.2.1.). COBEPS is sometimes required to evaluate cases reported to other organizations, if the identification is obvious. However, each association or group has its own protocols and we of course prioritize their classification. Without information, we classify in UAP X.
As for reports filed to COBEPS, in-depth investigations are carried out if the observation meets a set of four mandatory criteria and at least one optional criterion:
These observations are described in reports, some of which are made public, following the authorizations given by the witnesses. We sometimes carry out investigations in cases of observations that do not meet these criteria; either because it is an interesting case for training purposes of investigators or because the media have taken up the case or at the request of other organizations or even because the witnesses are particularly shocked and insist on being listened to.
Please note that witnesses can refuse a survey, even if the filtering parameters allow for it. We have no power of injunction; COBEPS being only a de facto association.
Evaluations carried out on observations recorded since 2011:
3.1. GEIPAN classification
Only 15 phenomena remain unidentified out of 732 cases classified according to the GEIPAN nomenclature, all associations and periods combined since 2011. The overall UAP D rate is 2.05 % (Figure 6).
3.2 Analysis of type A and B phenomena
In most cases, identification of type A phenomena is very quick and obvious. It generally does not require in-depth investigation. B cases are a little more difficult to identify because they lack some parameters or the descriptions are partially contradictory with the identification.
One of the recurring components from testimonies which leads to in an A-classification is that the descriptions are sufficiently precise and consistent to allow for a swift identification by the investigator. The witnesses are not victims of illusions, do not express fantasies but try to only express what they observed from their own perspective.
The most frequent identifications since 2010 are by far sky lanterns ( Figure 7 ). But since 2016, confusion with lanterns has decreased, which shows that the public now knows this type of object better, no longer points out to them as much as. And perhaps on top of that it was a trend that has faded away. Between 2019 and 2021, Starlink satellite trains and their launch rockets were very frequent sources of confusion (artificial satellites). These confusions currently continue to be registered at a rate of approximately 5 cases/year, a bit like meteors which represent the most regular source of confusion. Airplanes seem to be confused more and more often in recent years. In 2022, as with 2023, they are the most frequent source of confusion.
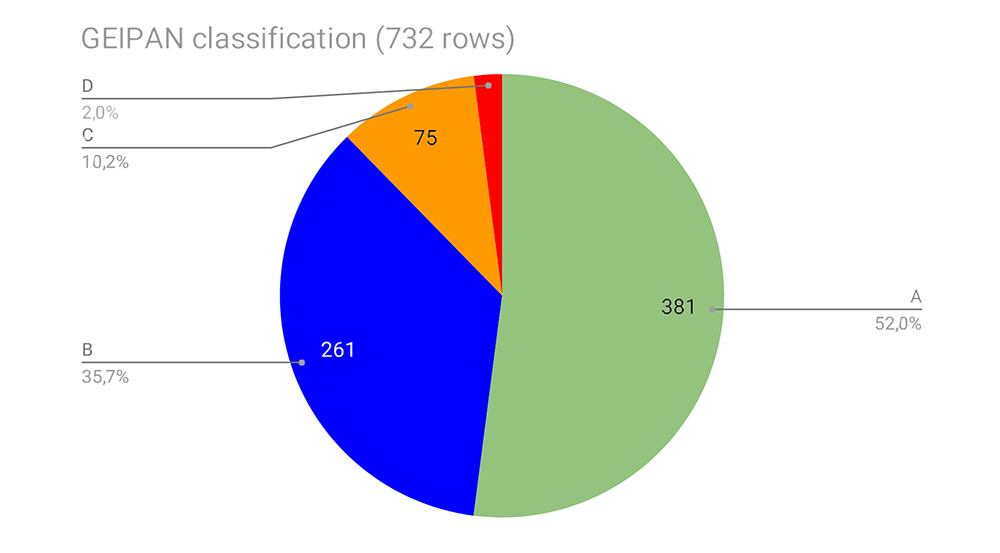
Figure 6: GEIPAN classification
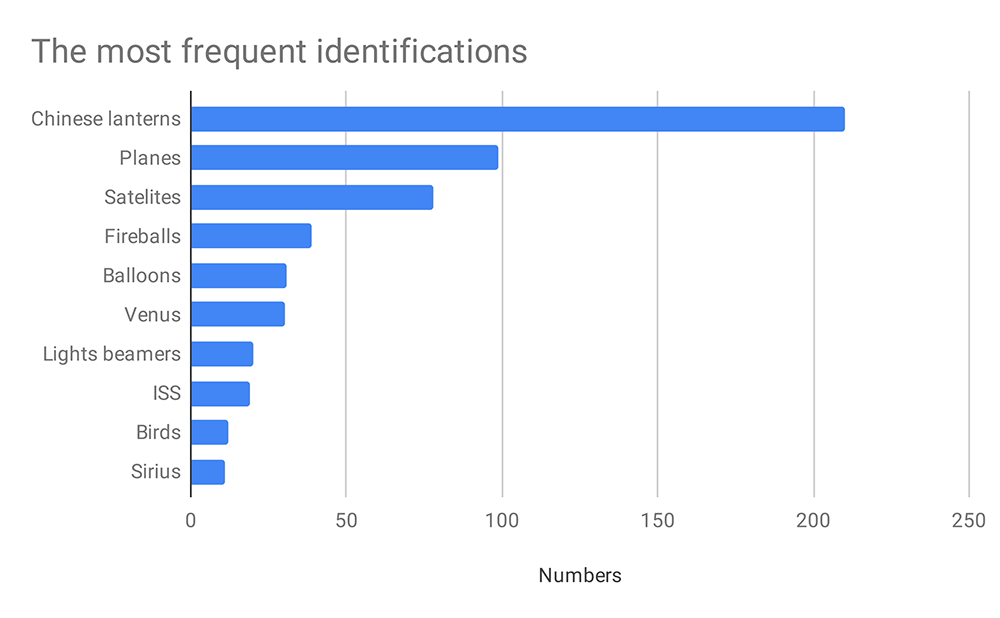

Figure 7: most frequent identifications and evolution over years
Drones still do not account for a significant source of confusion, which may raise questions as there are more and more of them in use and their performance is increasingly important. It is a fact that there is no way to check whether drones are in flight. There is a map of the areas where their flight is prohibited: https://map.droneguide.be/pages/francais.
Venus has also been very often misidentified, but the number of confusions varies very significantly depending on the years. This most likely depends on the visibility factor, but most certainly also on the brightness of Venus depending on its phases and the proximity to Earth.
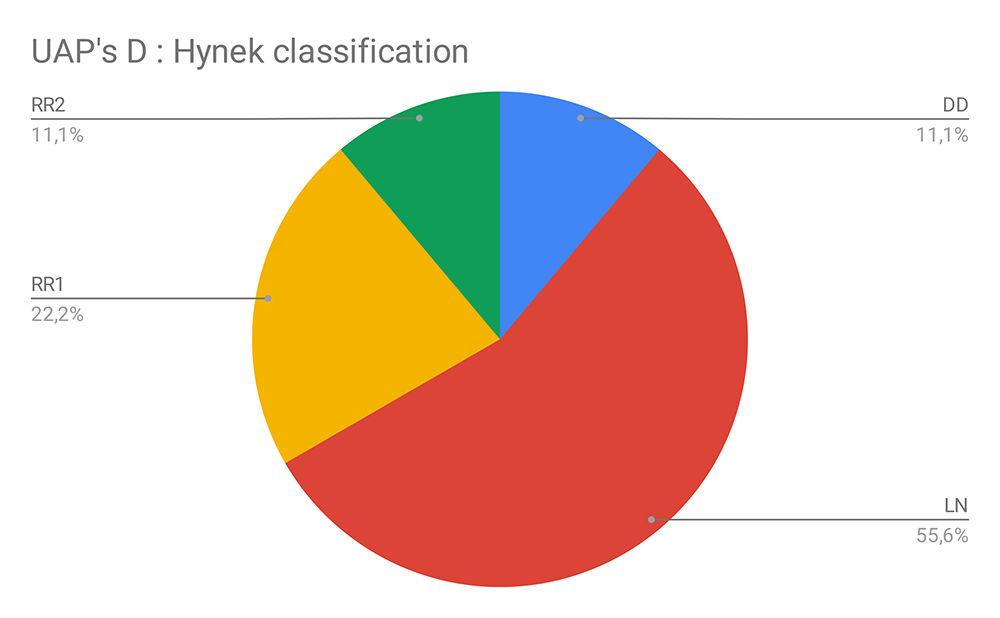
3.3 Analysis of PAN D
Throughout the full database, there are 22 UAP’s D; only 15 of which have been observed since 2011 and 17 are classified using the Hynek method. The map in Figure 8 locates these well-documented phenomena which are classified as unidentified, depending on how it was handled by investigators.
It is the years 2011 and 2012 which account for the most PAN D and often with the highest strangeness. The highest strangeness case, an RR2, is located about twenty kilometers northwest of Charleroi. The effects observed include spontaneous stopping of the light from a flashlight and the total darkening of photosensitive spectacle lenses. The witness, a lady aged over 70, approached less than 10 m from a luminous spherical object placed on the ridge of a roof and went around it.
There are also in this set four observations linked to the Belgian Wave which were reported after 2007. Only 10 UAP’s D were allocated by COBEPS, including the one mentioned above; the other 12 are the result of investigations by other organizations.
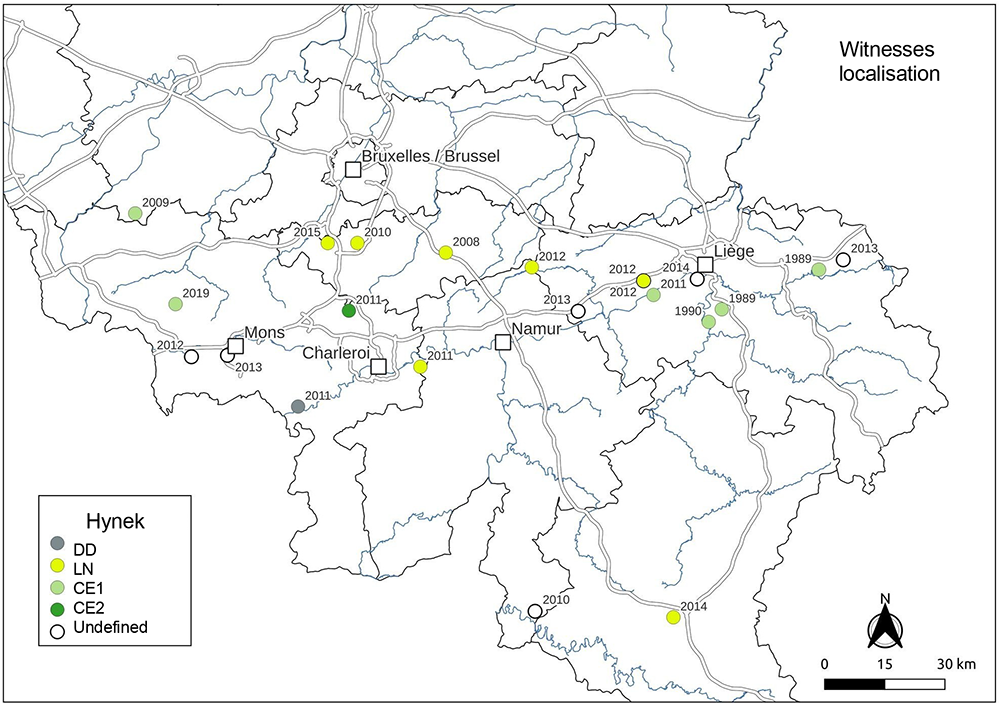
Figure 8: witnesses localisation of UAP’s D and Hynek classification
The largest share of UAP Ds, however, are daylight discs (DD) and nocturnal lights (LN) which offer little information on the UAPs encountered (58.9 %). CE1s generally make it possible to measure distances, dimensions and speeds. This is the case of the observations of Dolhain in 1989, of Renaix in 2009, of Engis in 2011, the four documented by COBEPS; or the observation of Belœil in 2019 investigated by the ORIGINE-AREPS group. In these different cases, the shapes observed are all triangular platforms, the upper part of which is rarely seen. The base of these platforms generally varies between 30 and 80 m in length.
The movements are slow but flexible, as are the maneuvers. These objects are also capable of staying in place for prolonged periods at very low altitude without seeming to fear touching high objects fixed to the ground (poles, buildings, vegetation) or colliding with it. Despite the proximity of the witnesses, these objects make little or no noise.